
Will an Aggressive Fed Hit Stocks Hard? Also, more on USD/JPY, Plus USD/CAD and USD/AUD

There is no doubt now, the Fed was perfectly clear this week - the next meeting will result in a 50bps move along with the implementation of reducing the Fed’s $9 trillion balance sheet.
I am sure you have read all of the headlines, so I will just provide some high level thoughts of what transpired this week. First, Lael Brainard, a Fed Governor and soon-to-be vice-chair, came out with comments this week that were far from dovish. You see, many have considered her to be one of the more dovish members - if she has turned hawkish, who is left? The answer is no one, the Fed has made a significant pivot over the last few months and having Brainard make these comments cements this fact.
She indicated that the Fed is prepared to take “stronger” action to combat inflation and will initiate a “rapid” reduction of the Fed’s balance sheet. These words indicate that a) we could see multiple 50bps moves this year, and b) even though the last time the Fed tried to reduce the balance sheet with the credit markets freezing up and they had to make a pivot in 2018, they are prepared to undertake an even more aggressive path this time.
This is extremely interesting. Why? We just don’t have that much experience with a Fed balance sheet reduction cycle. The last time credit markets froze up, equities sold off very hard.
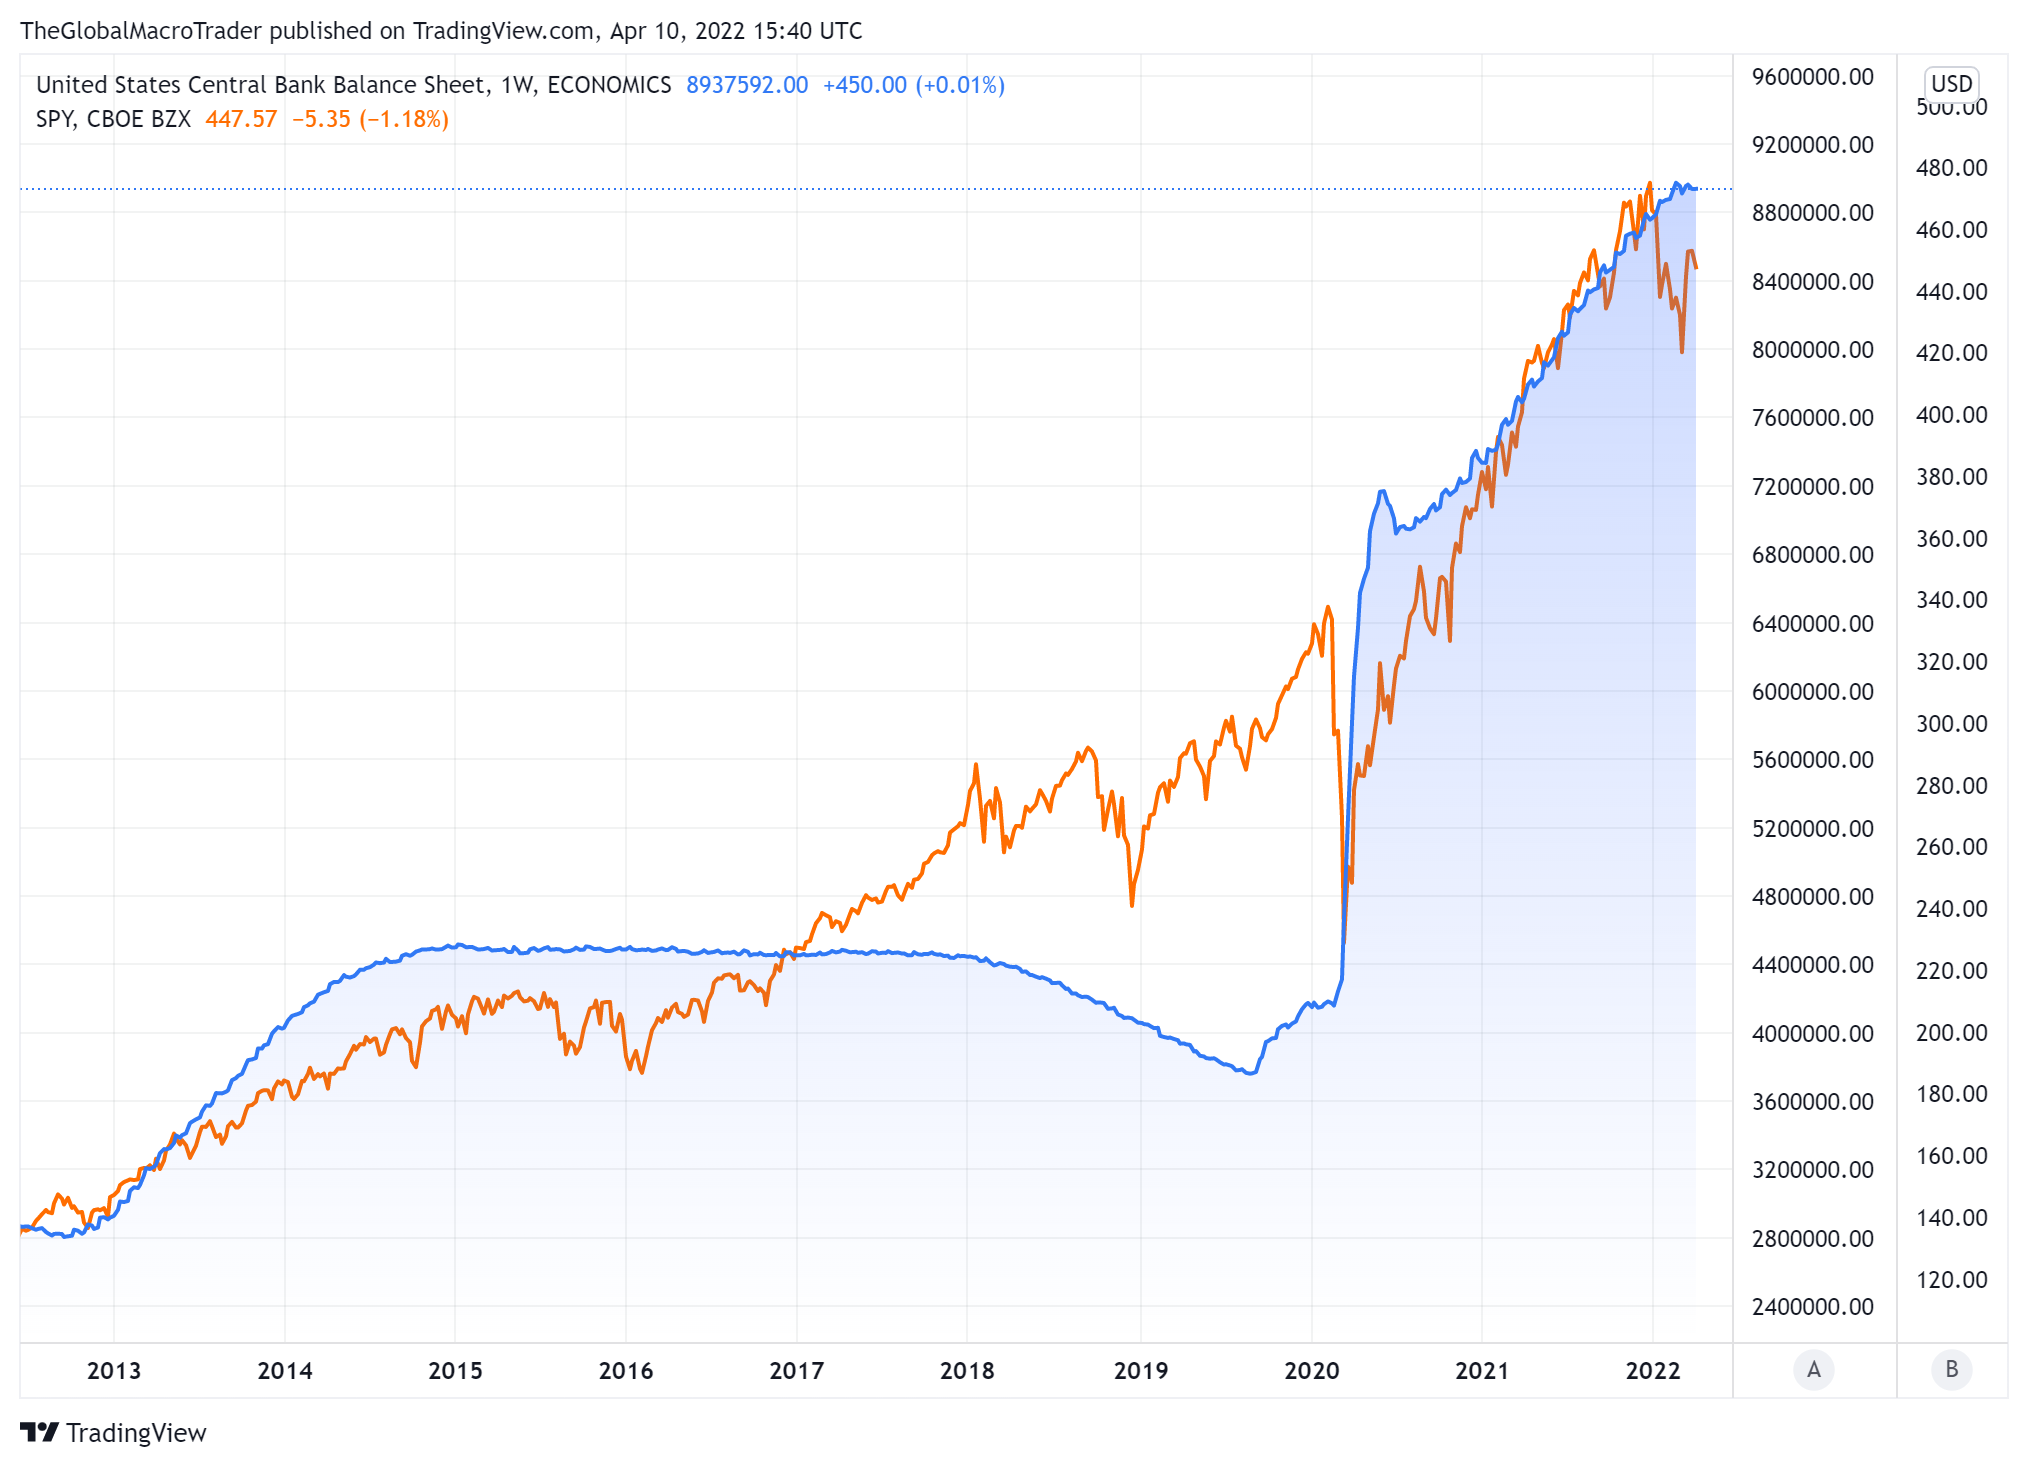
This is the Fed balance sheet (blue) against the S&P 500 ETF SPY (orange). It doesn’t look like much on this chart as equities have soared since then, but in late 2018 the equity markets, represented by the S&P 500, dropped approximately 18% from September to December of that year. The Fed had to quickly adjust their process to avert an even further decline.
A concern I have is that the current level of the Fed balance sheet is much larger than before, and the market was worried back then that it was quite large. Having such a large buyer out of the market means that the market will have to absorb all of this supply. The market has become very accustomed to the Fed as a buyer of trillions of dollars worth of Treasuries.
From the Fed minutes released on Wednesday, they stated their path on the reduction. It will total a maximum of $95 billion per month, consisting of $60 billion Treasuries and $35 billion mortgage-backed securities (MBS). The minutes also indicated that the Fed may consider selling MBS into the market if they do not roll off in a sufficient manner. The reason being, with interest rates rising, there will be fewer (if any) mortgage refinancing activity, leaving the portfolio pretty much with the existing duration.
This combined adjustment of rate increases and balance sheet reduction are a) larger than they were before in the 2015-2018 period, and b) will be initiated at the same time. During the last period, the Fed waited two years after initiative rate hikes before beginning to reduce their balance sheet. This is not a trivial difference.
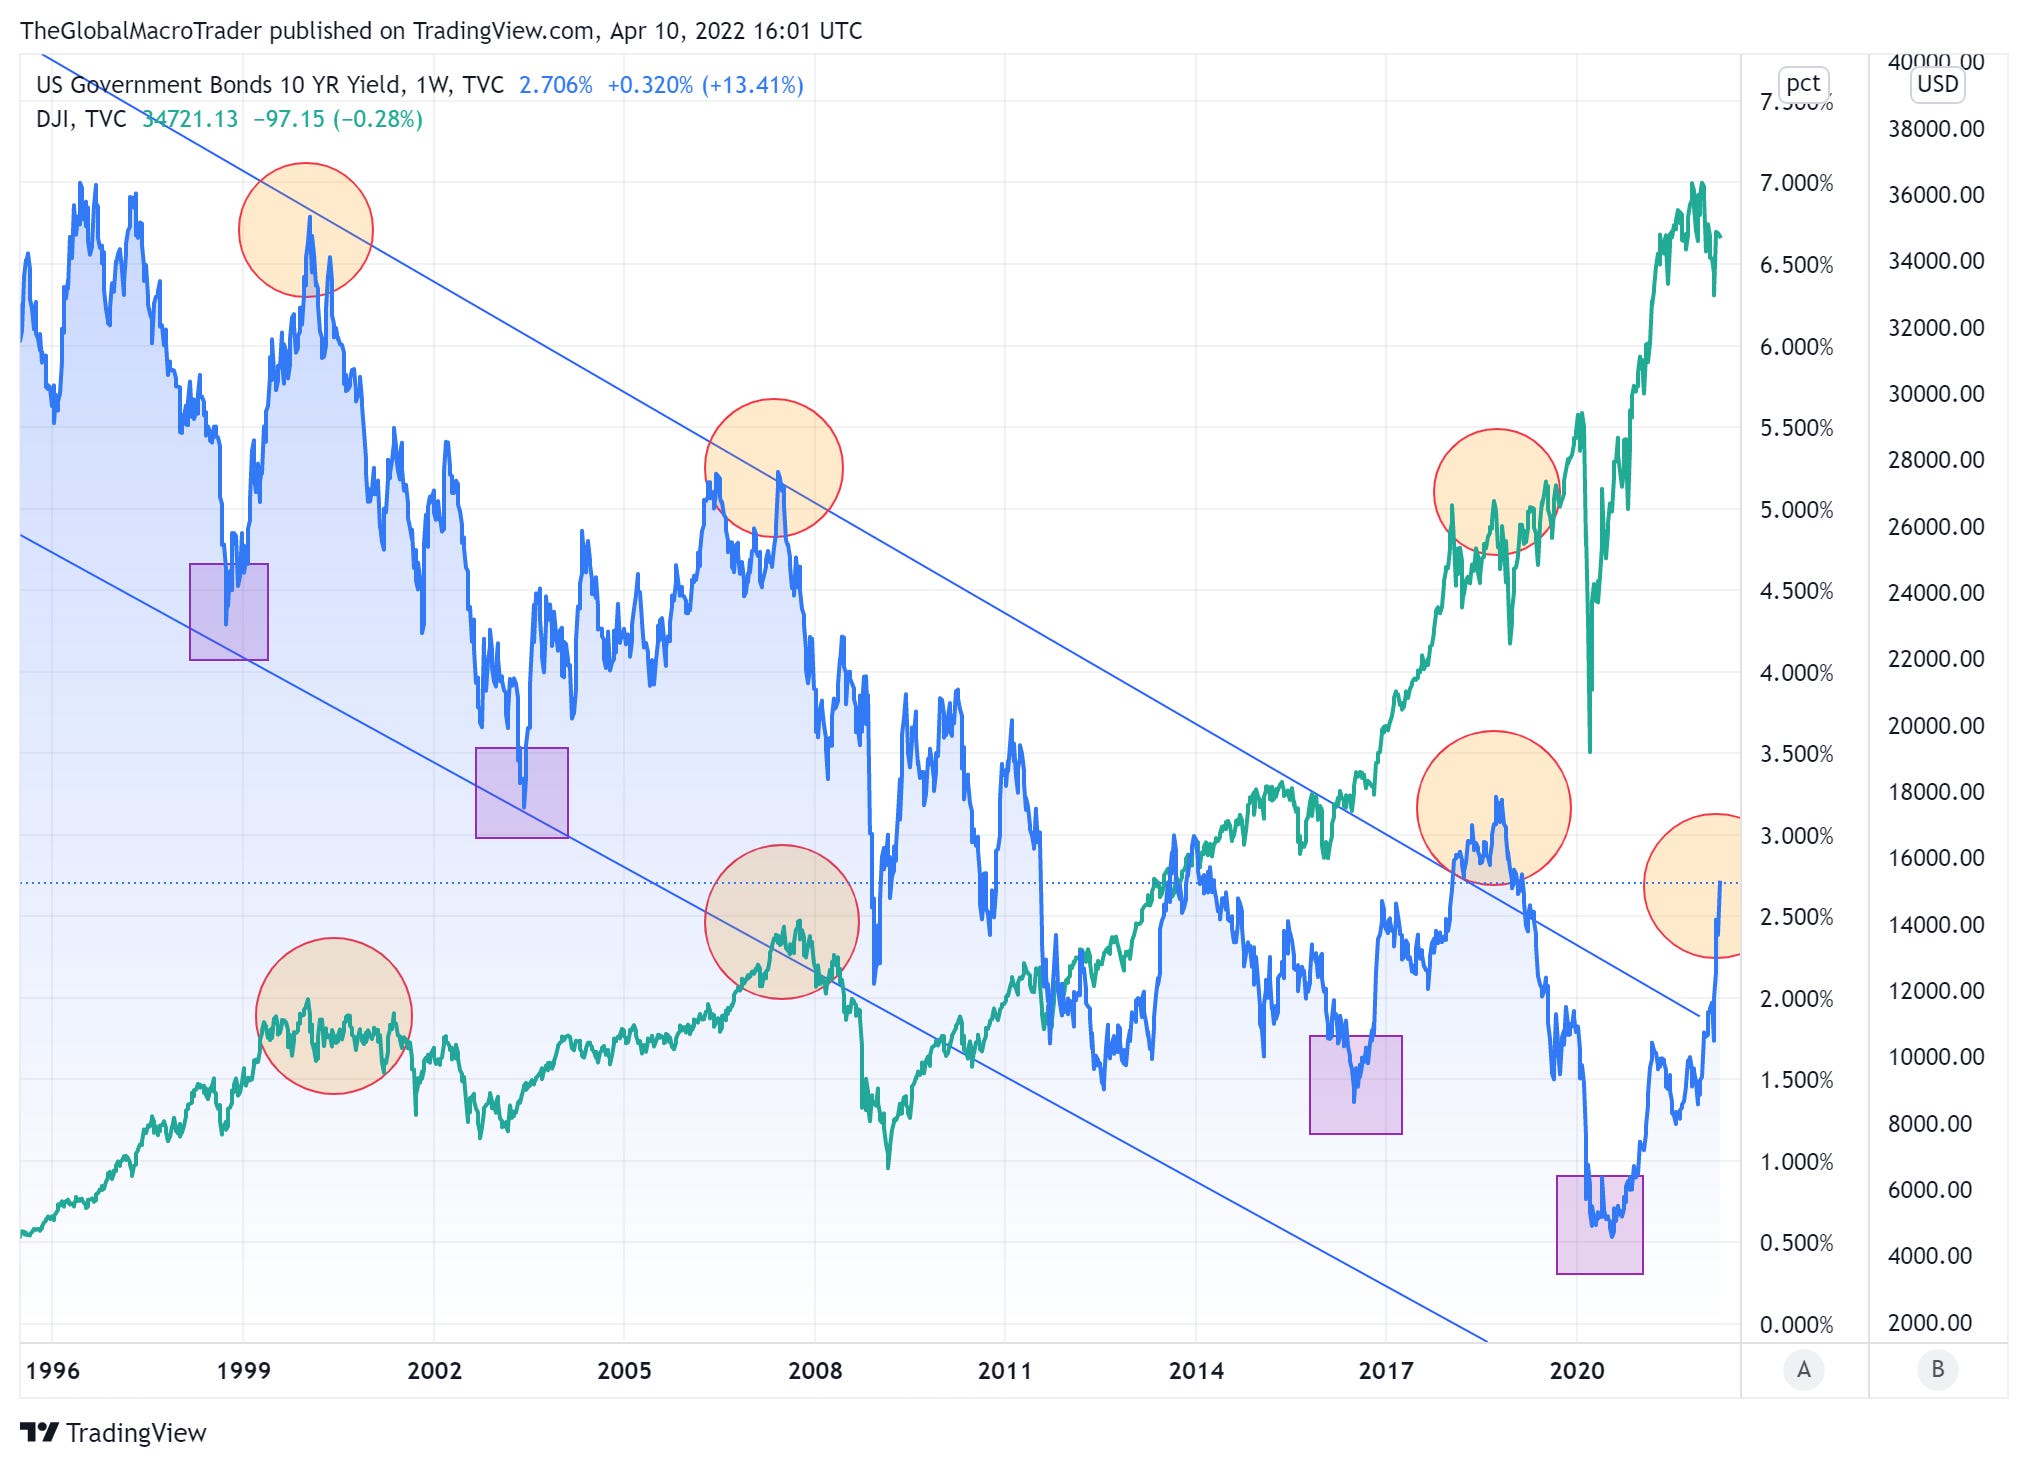
I apologize for this slightly busy chart, but I think it is a good illustration. In addition to a Fed that will be more aggressive than it has been in decades, long-term interest rates have already made a significant move higher. In this chart of the Dow Jones Industrial Average (green) representing the broader equity markets and the US 10 year yield (blue), I have added several circles and squares. On the US 10 year yield, the circles represented relative high points that were in an overall downward sloping trend for most of the last couple of decades. The circles on the equity markets represented where equity markets were when those yields were attained. The squares on the US yields indicate relative low points.
First, let me be clear, this is not a tool to time the market. This provides me some additional information of what is actually occurring and how similar (not the same, but similar) events in the past played out. From the relative lows in the yield in the past (squares) to the relative high points in yields (circles) was approximately a 2% move higher - that’s exactly where the US 10 year yield is now, moving up about 2% from the bottom. As you can see on the equity chart, the circles were close (again, not a timing tool) to relative highs in equity markets.
We are also moving higher from a much lower absolute level in interest rates. That is to say, a 2% move from a starting point of 0.50% is significantly larger in percentage terms than a 2% from a starting point of 4.5%
Higher yields will reverberate throughout a) the economy and b) equity valuations. As businesses and home owners seek new funding, it will come at a higher cost, at the same time that inflation is rampant. Again, another factor that is significantly different from the past few decades, we now have massive inflation. Second, equity valuations will need to be adjusted. That is to say, if you calculate the discounted cash flow of a business, the discount rate will be higher. Those long duration assets (ie no income, super high growth stocks) might have an even more significant negative reaction.
Again, we have not witnessed the following combination potentially ever; 1) this level of inflation, 2) current Fed funds rate so low versus the where the economy is operating (ie easy monetary policy that is incorrect with current fundamental dynamics), 3) inflation expectations so high, 4) a large move higher in longer term interests from generational lows, 5) equity markets still quite near the all-time highs 6) the starting point of interest rates being at such low levels. No one will really know what will happen, but I think it is a stretch to simply close one’s eyes and assume all will be fine when the markets broke down in the past with less uncertainty.
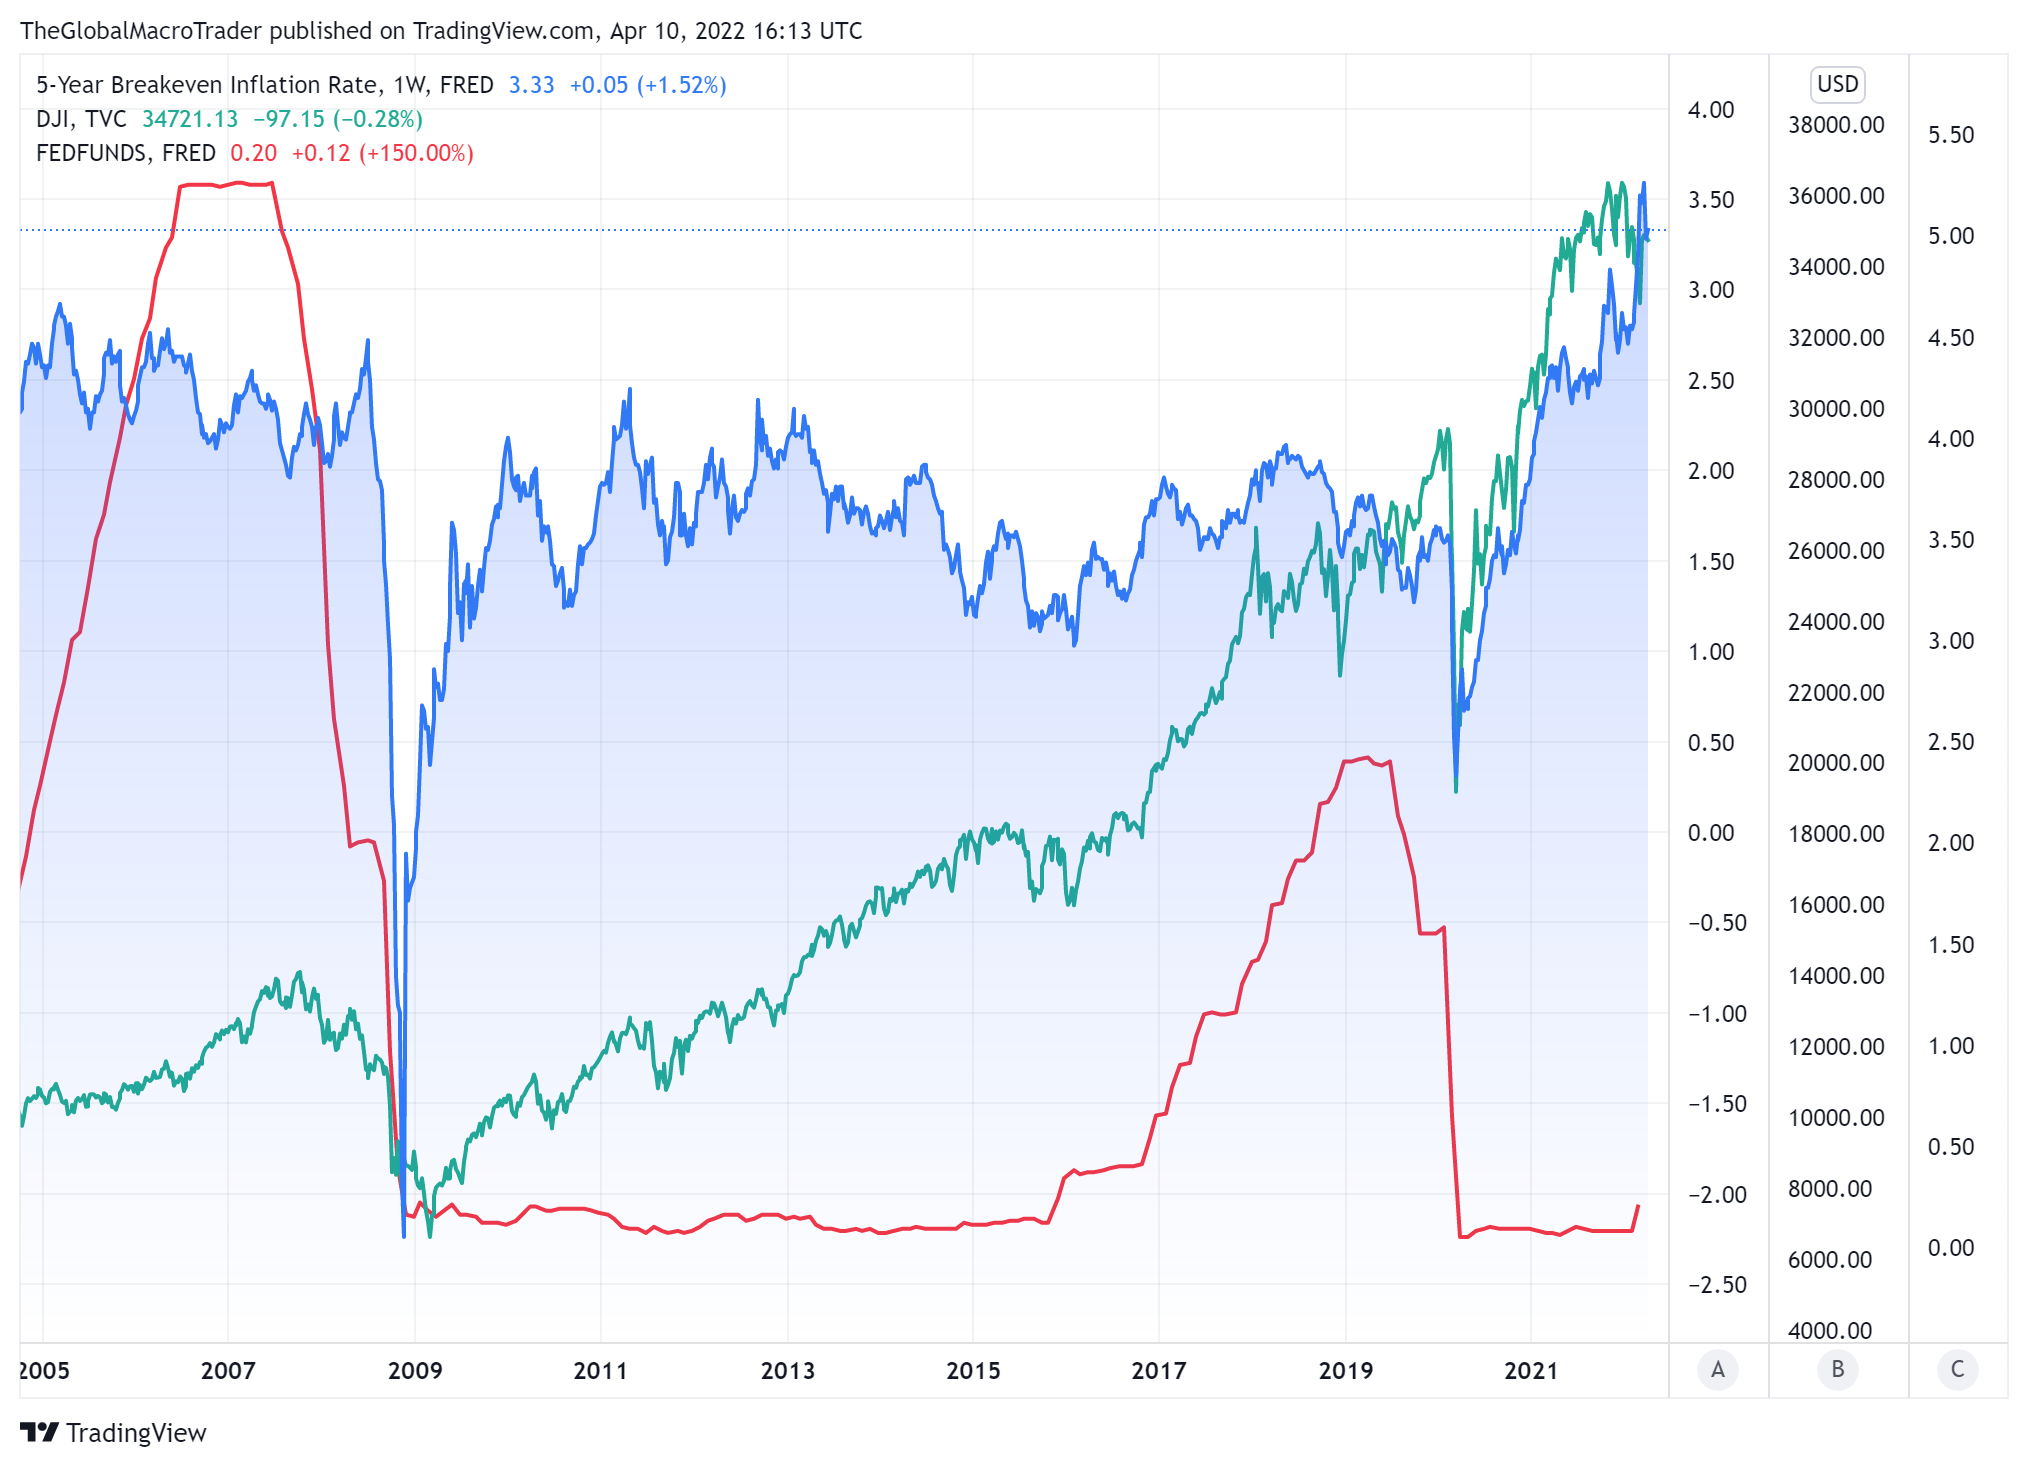
Here is a chart of the 5 year breakeven inflation rate (blue), DJIA (green) and Fed Funds rate (red). Inflation expectations are, to no one’s surprise, higher than they have been in decades, the Fed Funds rate is extremely far from neutral and yet equity markets remain near the highs. I find it difficult to believe that in the face of such uncertainty, a more aggressive and a restrictive Fed that the equity markets will remain resilient.
As I noted in my article last week, I trimmed a significant portion of my equity holdings and I still remain on the sidelines. After making a large move higher over the past few weeks, I thought it prudent given all of what I just outlined (and discussed in last week). Certainly if there is an announcement of peace in the Ukraine-Russia war, this will create a positive, risk-on impetus, but I think that will be temporary.
We are also entering earnings season. I think companies will issue cautious if not outright negative guidance for the remainder of the year. Why not? I can’t imagine a CEO in almost any industry having the vision of how the next year will play out. There remains supply shortages, inflation, they can’t find workers, more potential covid lockdowns - in my opinion, I think many CEOs will use this earnings season to revise guidance levels down to then give them an easier path to beating those numbers over the next year.
Could I be wrong? Absolutely! I cannot predict the future, only review the landscape and determine where the probabilities are highest, but they are still only probabilities and not certainties. Perhaps there is a peace deal announced, inflation drops massively over the next few months, more workers pop out of nowhere, and CEOs become increasingly confident over the next year as the Fed embarks on a massive monetary policy shift. I think this is all unlikely, but it is possible.
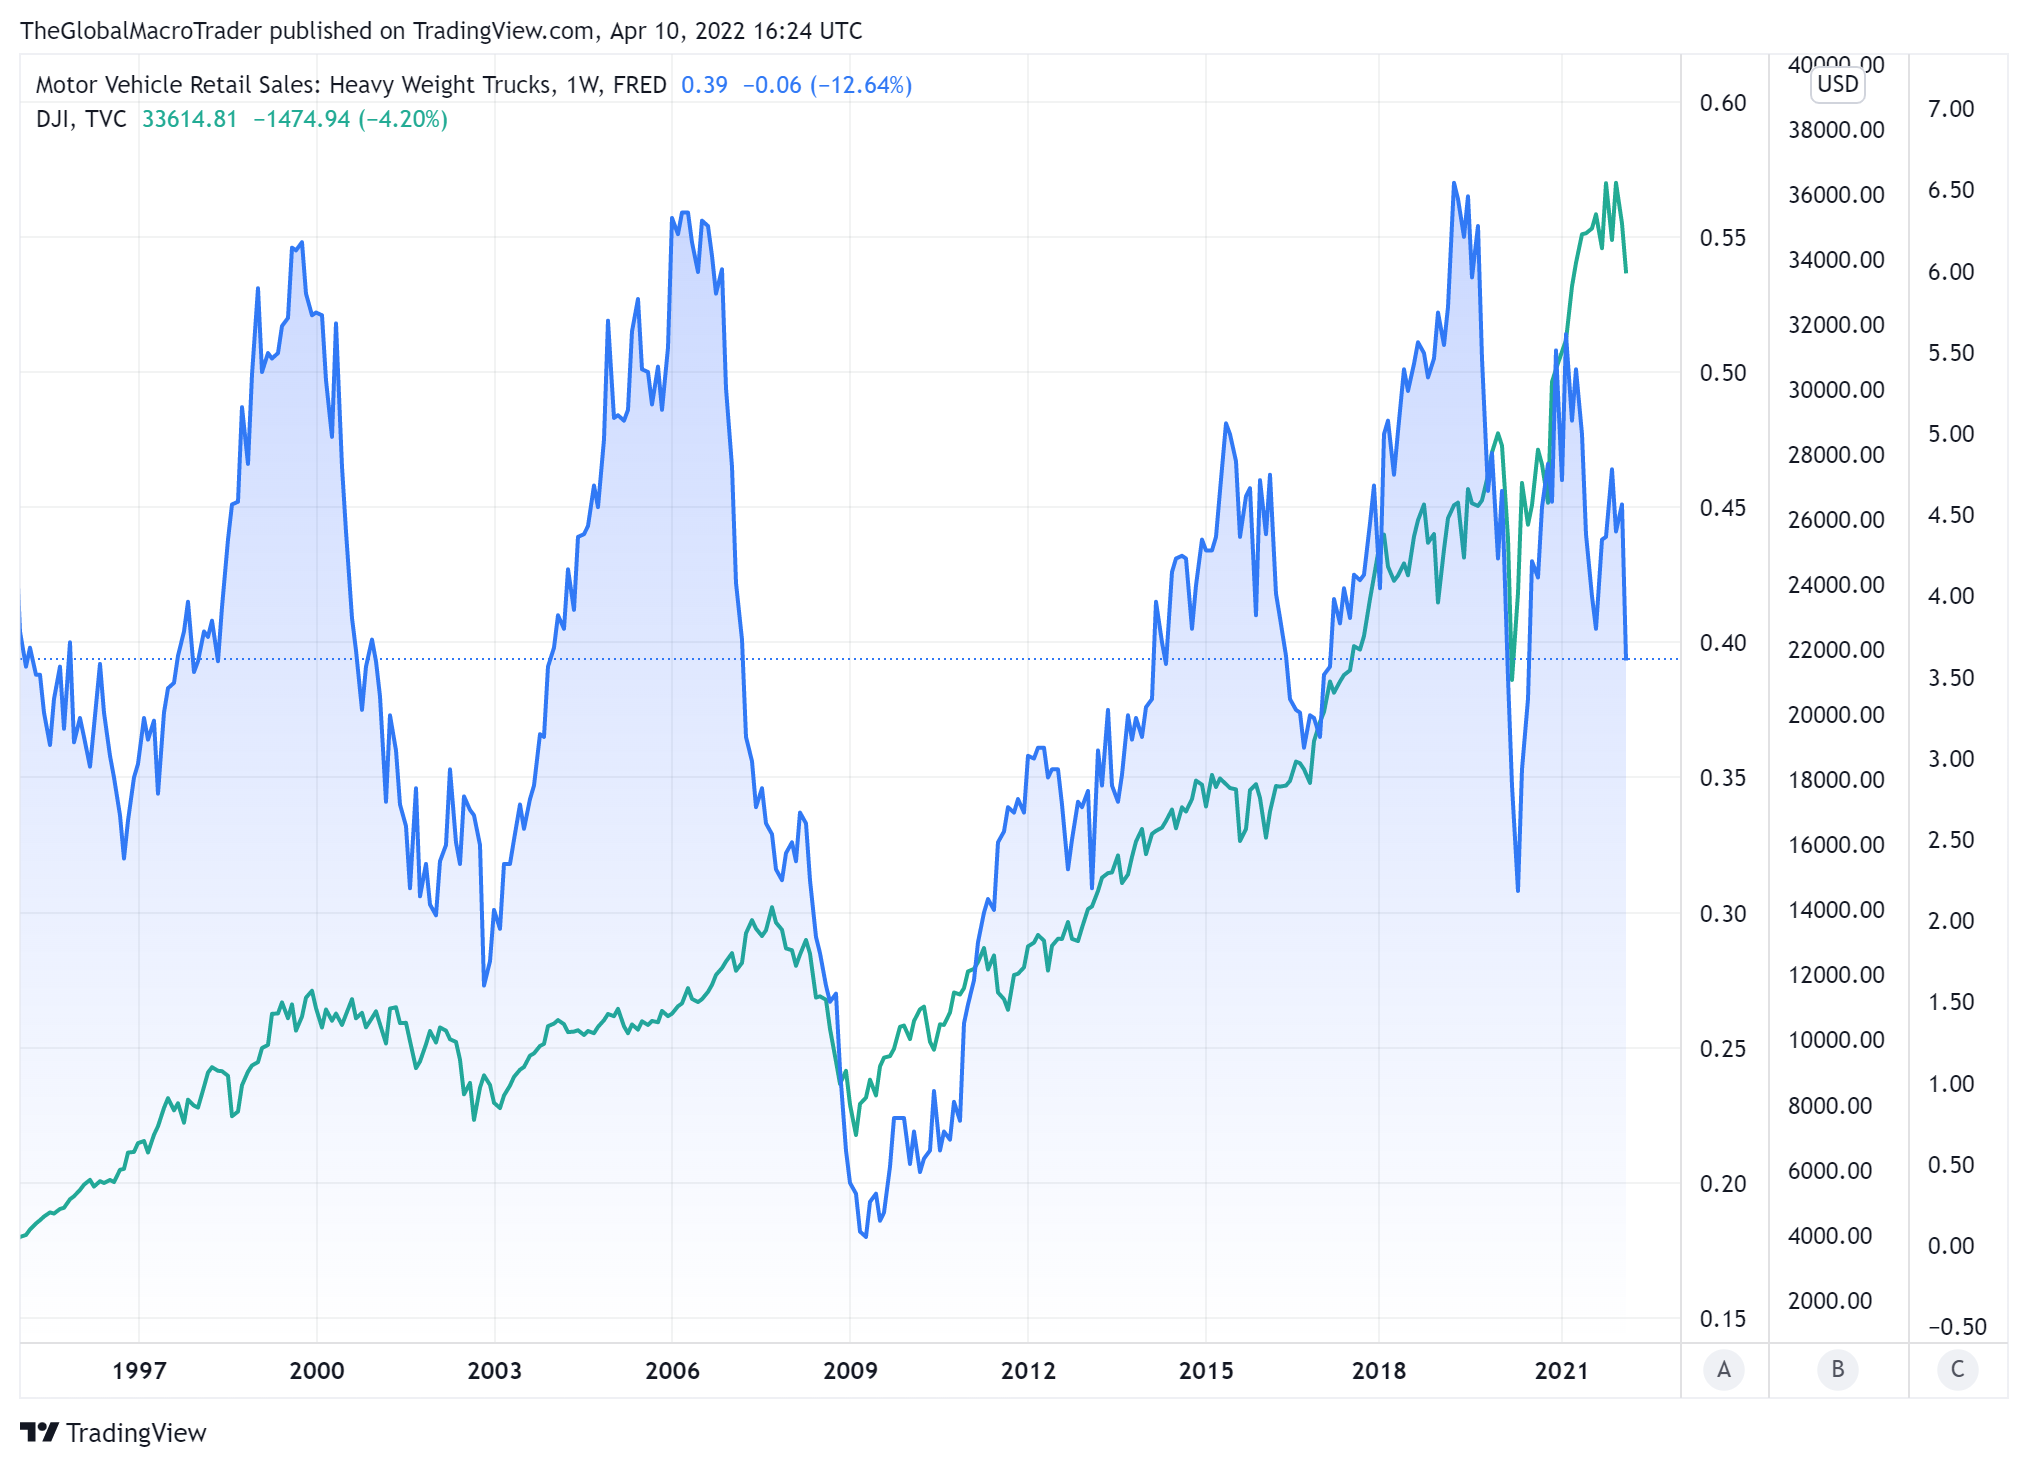
One indicator that I like and have talked about in the past is heavy truck sales (blue) and the DJIA (green). This is an indication of sentiment by businesses. While still relatively high, it is now dropping quite sharply. This speaks to my earlier point, I think businesses may start to pullback on large spending plans amid all of the uncertainty. As interest rates rise, this will also hurt investing plans, as they become costlier.
A few quick currency thoughts:
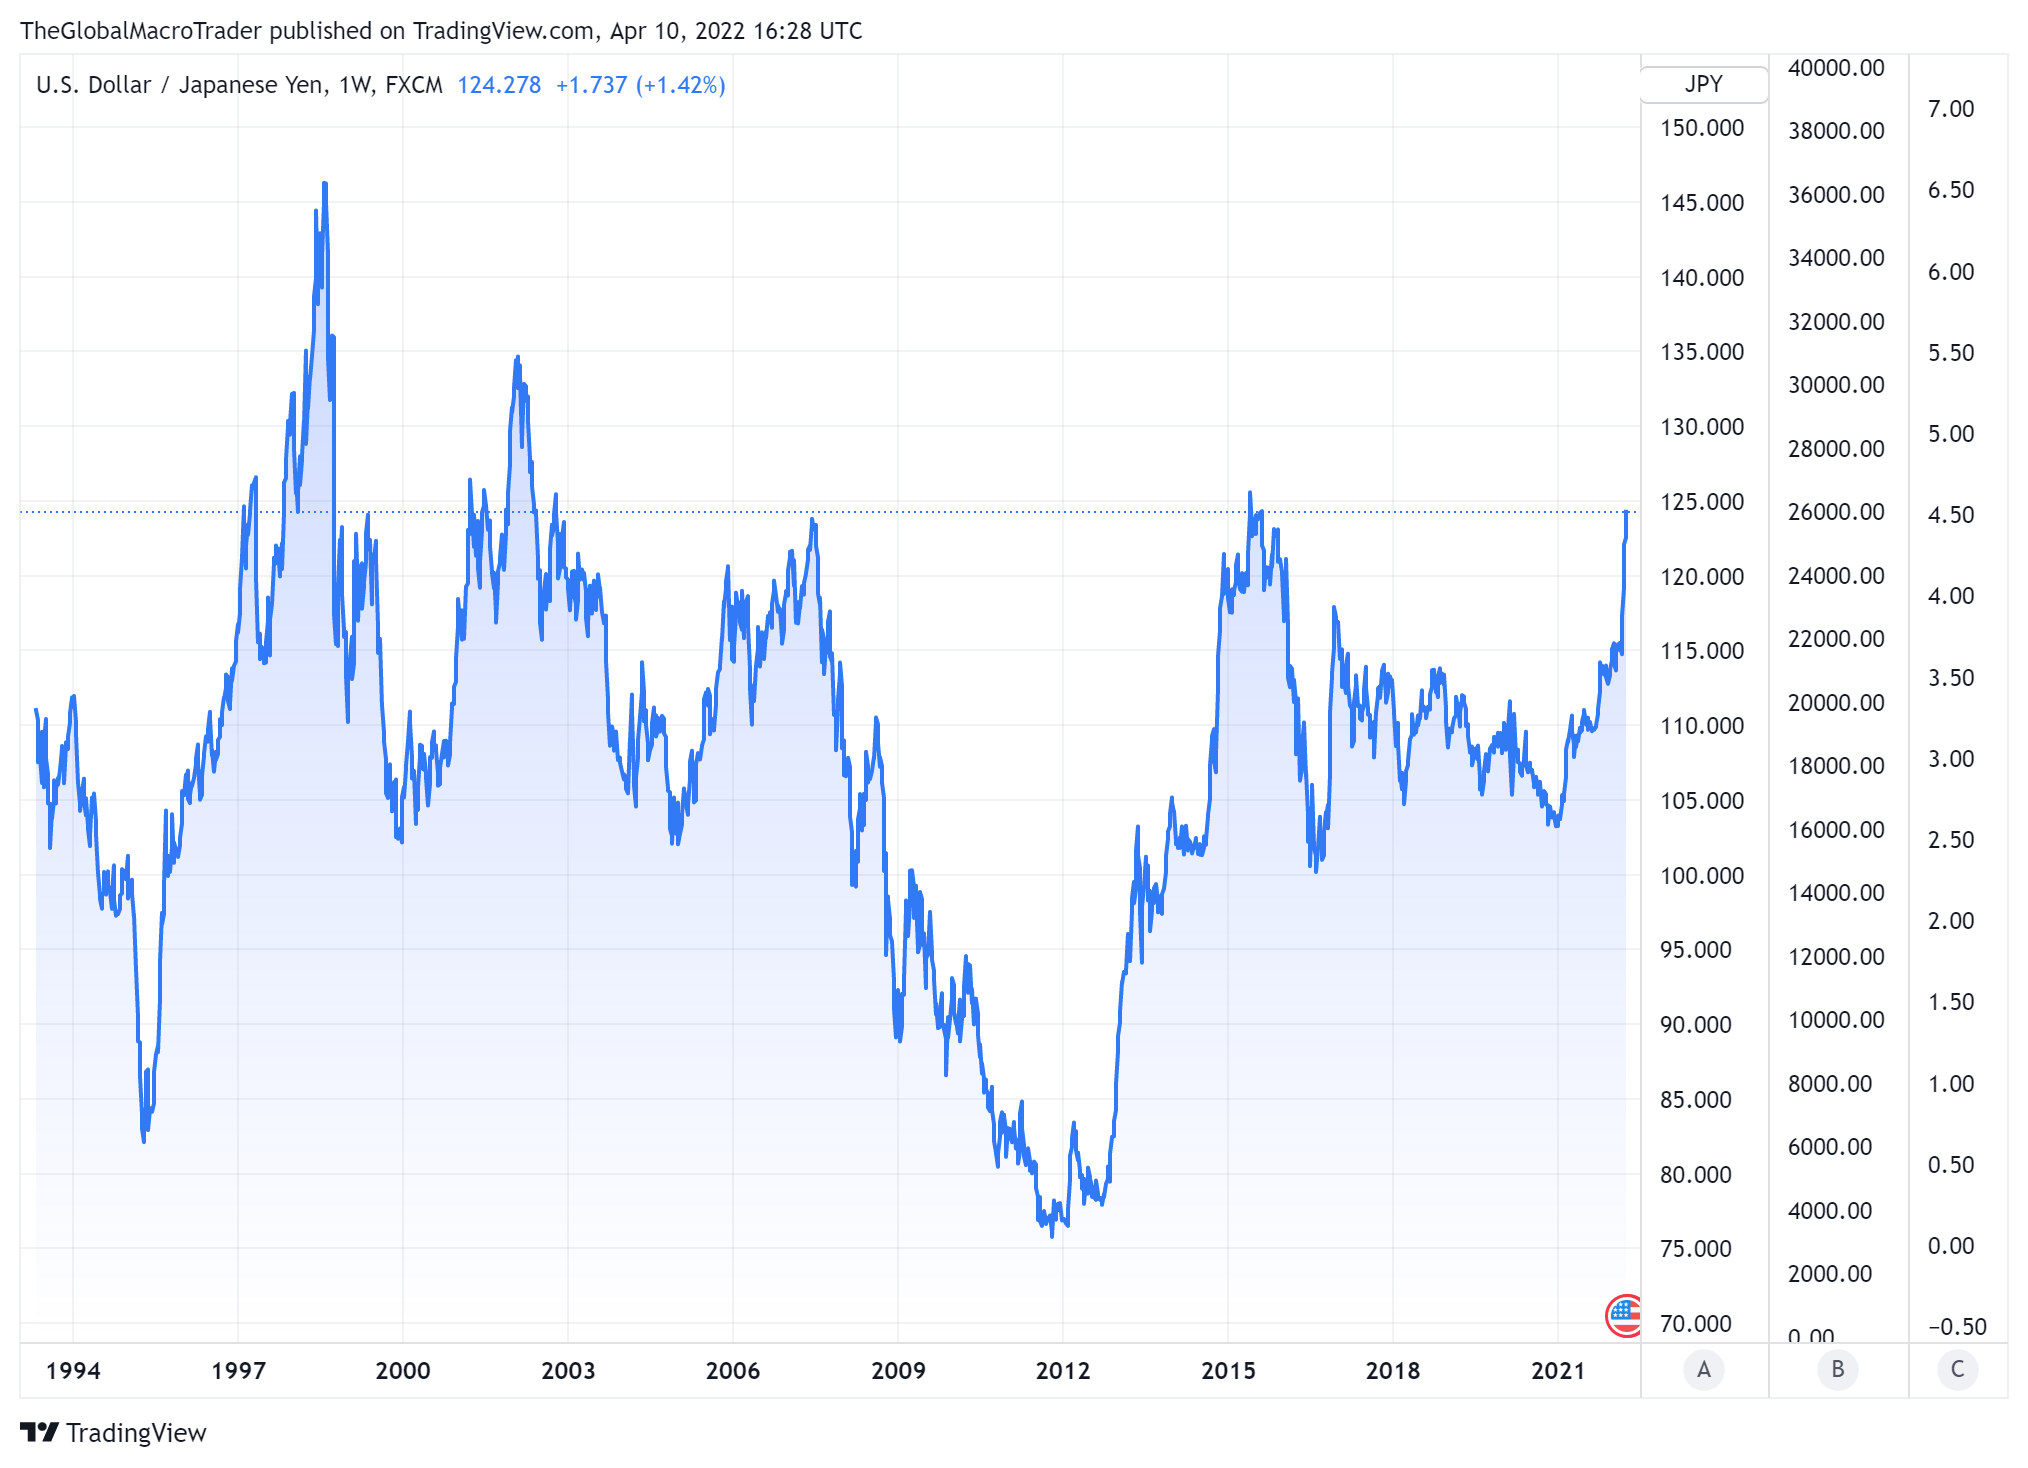
There are probably no two central banks on paths that are so different. The US Fed is moving to become very aggressive, the Bank of Japan (BOJ) is on the complete opposite side, remaining very accommodative. I have liked this trade for quite a while and will try to use any pullbacks to re-enter positions I took off for profits.
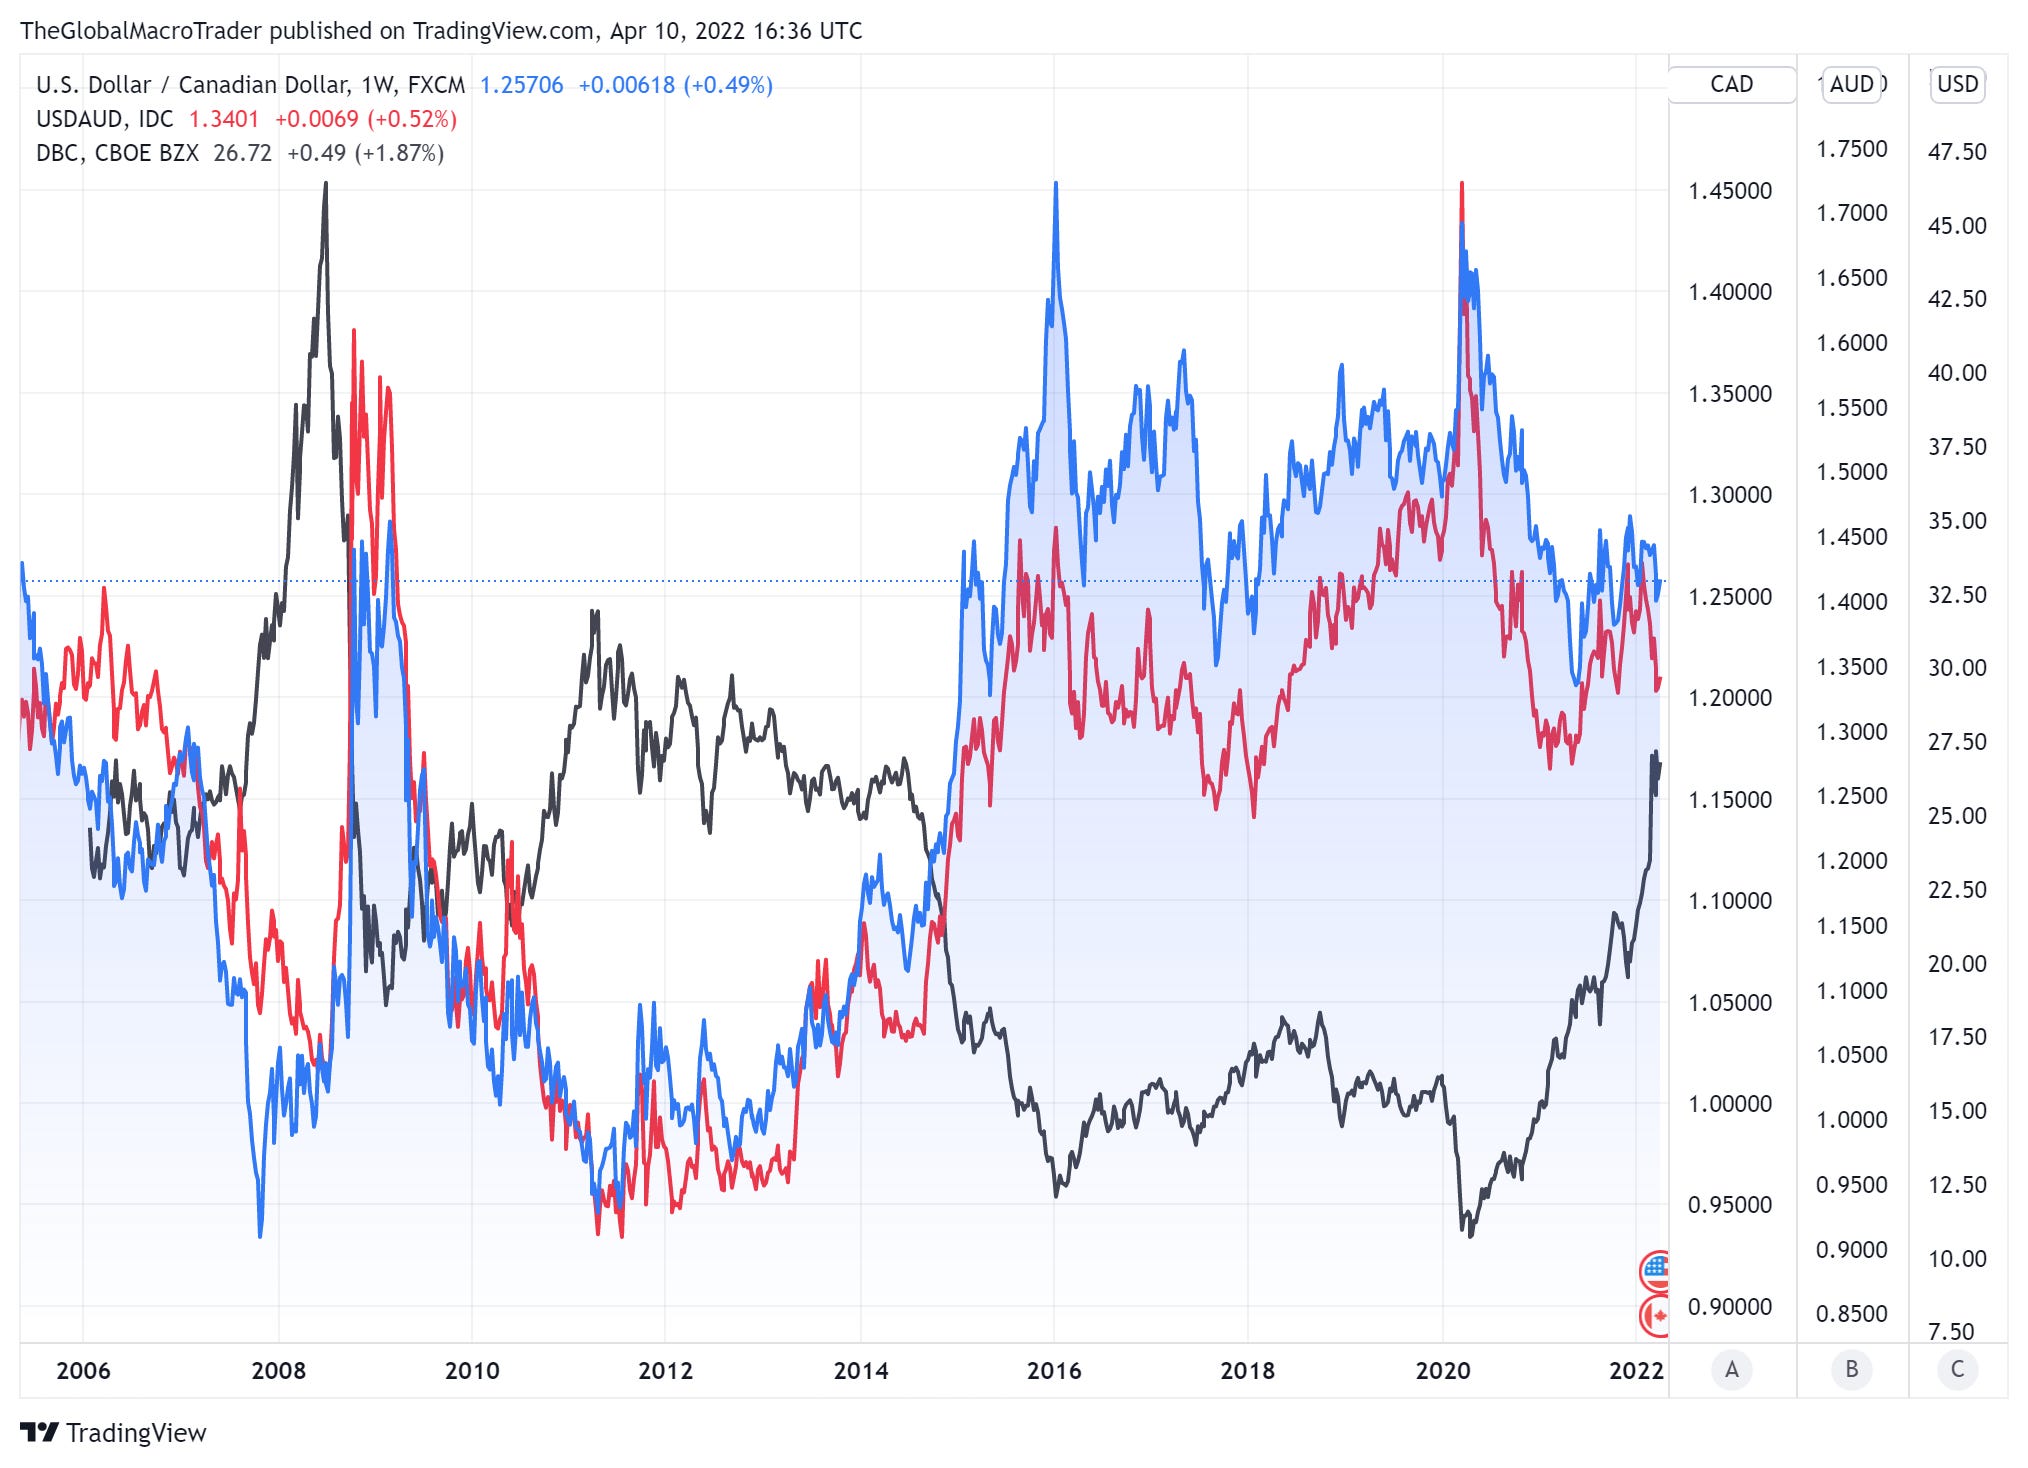
This chart includes the USD/CAD (blue), the USD/AUD (red) and the Invesco DB Commodity Index Tracking Fund DBC (black). The two currencies tend to be quite correlated with commodities, with the DBC a decent approximate of commodities generally as it holds oil, gas, gold, wheat, corn, soybeans and so forth. Again, this is not a perfect correlation, as there are many factors at play, but I would have thought that both currencies would have strengthened more versus the dollar with the recent rise in commodity prices. In my opinion, I would have expected a move closer to USD/CAD of 1.22 and USD/AUD of 1.29. I will keep watching these currency pairs and may trade for moves in that direction.
Thanks for reading!
theglobalmacrotrader@gmail.com
Disclaimer
Copyright (c) TheGlobalMacroTrader.com 2022. All rights reserved. All material presented either through this website, Substack, any newsletter published by this site, posts on any social media platform and other public comments are not to be regarded as investment advice, but for general informational and entertainment purposes only. You, the reader, assume the entire cost and risk of any trading you choose to undertake. You, the reader, are solely responsible for making your own investment decisions. Owners of this newsletter, its representatives, its principals, are NOT registered as securities broker-dealers or investment advisors either with the U.S. Securities and Exchange Commission or with any securities regulatory authority. We recommend consulting with a registered investment advisor, broker-dealer, and/or financial advisor. If you choose to invest with or without seeking advice from such an advisor or entity, then any consequences resulting from your investments are your sole responsibility. Reading and using this newsletter or using our content on the web/server, you are indicating your consent and agreement to our disclaimer. The information contained herein has been obtained from sources believed to be reliable, but is not necessarily complete and its accuracy cannot be guaranteed. No representation or warranty, express or implied, is made as to the fairness, accuracy, completeness, or correctness of the information and opinions contained herein. The views and the other information provided are subject to change without notice and are for entertainment purposes only, no advice has been presented and no recommendation have been made. All information on TheGlobalMacroTrader.com, and any associated pages such as the SubStack pages, are issued without regard to the specific investment objectives, financial situation, or particular needs of any specific recipient and are not to be construed as a solicitation or an offer to buy or sell any securities or related financial instruments. Past performance is not necessarily a guide to future results. Company fundamentals and earnings along with discussion over chart formations and quantitative metrics may be mentioned, but should not be construed as a recommendation to buy, sell, or hold the company’s stock. Predictions, forecasts, and estimates for any and all markets should not be construed as recommendations to buy, sell, or hold any security—including commodities, currencies, stocks, bonds, exchange traded funds (ETF), exchange traded notes (ETN), mutual funds, futures contracts, or any similar instruments. All text, images, ideas and concepts on TheGlobalMacroTrader.com and associated websites, emails, posts and social media messages constitute valuable intellectual property. No material from any part of TheGlobalMacroTrader.com and associated websites, emails, posts and messages may be downloaded, transmitted, broadcast, transferred, assigned, reproduced or in any other way used or otherwise disseminated in any form to any person or entity, without the explicit written consent of TheGlobalMacroTrader.com. All unauthorized reproduction or other use of material from TheGlobalMacroTrader.com and associated websites, pages and emails shall be deemed willful infringement(s) of this copyright and other proprietary and intellectual property rights, including but not limited to, rights of privacy. The recipient should check any email and any attachments for the presence of viruses. TheGlobalMacroTrader.com accepts no liability for any damage caused by any virus transmitted by this company’s website, emails, attachments, posts and any other method of communication. TheGlobalMacroTrader.com expressly reserves all rights in connection with its intellectual property, including without limitation the right to block the transfer of its products and services and/or to track usage thereof, through electronic tracking technology, and all other lawful means, now known or hereafter devised. TheGlobalMacroTrader.com reserves the right, without further notice, to pursue to the fullest extent allowed by the law any and all criminal and civil remedies for the violation of its rights.